Collecting Developer Activity Without Making It Nonsense
The last two articles covered the board snapshot and the fifteen-minute delivery collector. This one is the third and last GitHub collector: commits, merged pull requests and closed issues, per person, so we can see throughput over time.
This is the most sensitive of the three, in two senses. It is about people rather than systems, which means being wrong about it has a cost beyond a bad chart. And the raw data has two properties that will quietly produce a wrong answer if you do not handle them: bots that commit like people, and people who appear twice.
One table, three activity types
The shape is deliberately the same as the CRM engagement table from earlier in this series. Commits, merged PRs and closed issues land as one stream with an ActivityType:
activity_columns = [
  { name = "TimeGenerated", type = "datetime" },
  { name = "ActivityDate",  type = "datetime" },
  { name = "ActivityType",  type = "string" },
  { name = "Actor",         type = "string" },
  { name = "Repository",    type = "string" },
  { name = "Key",           type = "string" },
  { name = "Number",        type = "int" },
  { name = "Title",         type = "string" },
  { name = "Url",           type = "string" },
  { name = "Labels",        type = "string" },
  { name = "LabelArray",    type = "dynamic" },
]
The reason is the same as it was for engagements. A per-person heat map wants one table to group, not three joined at read time. Three tables would mean three queries and a union in every panel that asks “what did this person do”.
ActivityDate is when the work happened, not when we read it. Commits carry the author date, so a backfilled collection still lands them on the correct day.
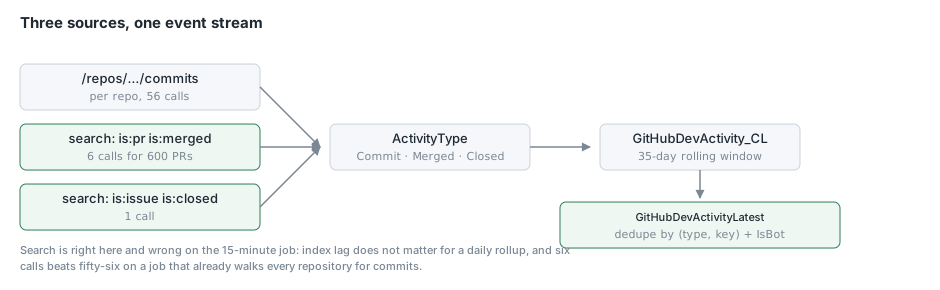
Key is the dedup key: a SHA for a commit, an object id otherwise. The daily job re-reads a thirty-five day window, so every row is written many times deliberately, and the saved function collapses them:
GitHubDevActivity_CL
| summarize arg_max(TimeGenerated, *) by ActivityType, Key
This one goes on the daily job
These are immutable facts about the past. A commit made last Tuesday will still have been made last Tuesday. Re-reading thirty-five days of them every fifteen minutes would write hundreds of thousands of rows to say nothing new, so this collection is bolted onto the daily job rather than the fast one.
The window is thirty-five days against a thirty day heat map, for the same reason the CRM window was wider than its report: the edge of the collection window should never be the edge of the chart.
Search is right here
The previous article argued for per-repository endpoints over search, because search is an index and it lags. On a daily rollup that lag does not matter, and the saving is real.
Merged pull requests and closed issues both come from search:
for PAIR in "is:pr merged:>=${ACTIVITY_SINCE_DAY}:PullRequestMerged" \
            "is:issue closed:>=${ACTIVITY_SINCE_DAY}:IssueClosed"; do
  QRY="${PAIR%:*}"; TYPE="${PAIR##*:}"
  SPAGE=1
  while :; do
    ENC=$(jq -rn --arg q "org:${GITHUB_ORG} ${QRY}" '$q|@uri')
    gh_json "https://api.github.com/search/issues?q=${ENC}&per_page=100&page=${SPAGE}" > "${WORK}/s.json"
    N=$(jq '(.items // []) | length' "${WORK}/s.json")
    [[ "$N" == "0" ]] && break
    ...
    [[ "$N" -lt 100 || "$SPAGE" -ge 10 ]] && break
    SPAGE=$((SPAGE + 1))
    sleep 2
  done
done
Six calls for six hundred pull requests, against fifty-six if we walked repositories.
Two guards in there. The sleep 2 respects the search rate limit, which is thirty requests a minute rather than the five thousand an hour the core API allows. And the page cap at ten exists because the search API caps a result set at a thousand: past that the lookback window is simply too wide, and the right response is to reduce it rather than page into a wall.
Commits have no search equivalent that reliably gives per-commit authorship, so those are listed per repository. That is the part that made the daily job’s timeout grow to an hour.
The two things that make this wrong
Here is where the article earns its title.
Bots commit like people
Our activity data contains github-actions[bot], dependabot[bot], and two coding agents that commit under plain names with no suffix at all.
On a per-developer chart, bots are not a minor contaminant. Automated dependency bumps and generated client commits are exactly the kind of high-volume, low-effort work that dominates a commit count. Left in, they sit near the top of every chart and the humans are compressed underneath.
The obvious check catches half of them:
| extend IsBot = Actor endswith "[bot]"
That misses the coding agents entirely, because they commit as an ordinary name. So the list is configuration:
variable "bot_actors" {
  type    = list(string)
  default = []
}
bot_actors = ["dependabot", "github-actions", "Copilot", "claude"]
| extend IsBot = Actor endswith "[bot]"
                 or Actor in (${join(", ", formatlist("\"%s\"", var.bot_actors))})
They are flagged, not dropped. Every developer panel filters them out, and one headline stat reports what share of merge traffic they account for, because “how much of our throughput is automated” is a fair question. It is just not a developer question.
One person, two identities
This one is subtler and it is the reason I would tell anybody building a developer metrics dashboard to look at the raw actor list before they build anything.
A commit’s GitHub account is resolved from the email address in the commit. If that email is not attached to a GitHub account, the API returns a null author, and the only name available is whatever is in the local git config.
So the collector falls back:
Actor: (.author.login // .commit.author.name // "(unknown)"),
Which keeps the work rather than dropping it, and produces two rows in the actor list for one human. Our data had a person with 2,263 rows under their login and 17 under their full name, and another with 149 under a first name and 90 under a login. Two people, four identities.
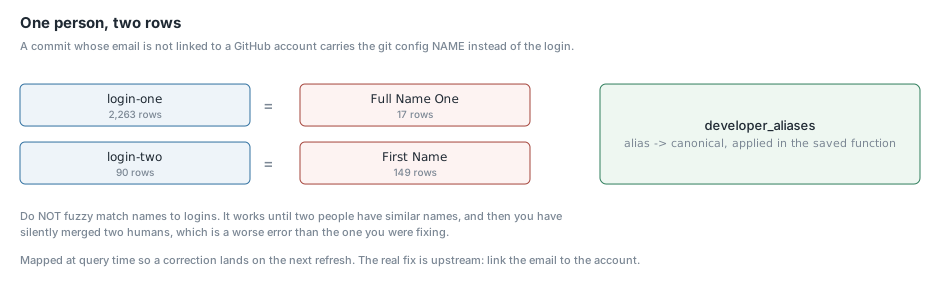
On a leaderboard that is not a rounding error. It splits somebody’s output across two rows, neither of which is right, and if the two spellings sort apart nobody notices they belong together.
There are three ways to handle this and only one of them is safe.
You could fuzzy match names to logins. Do not. It works until two people have similar names, and then you have silently merged two humans’ work, which is a much worse error than the one you were fixing.
You could fix it in the collector. That means re-collecting to correct a mapping, which is exactly the wrong place for something that will need adjusting as people join.
Or you map it at query time, from configuration:
variable "developer_aliases" {
  description = "Alias -> canonical. Applied in the saved function so a correction lands on the next refresh."
  type        = map(string)
  default     = {}
}
developer_aliases = {
  "Full Name One" = "login-one"
  "First Name"    = "login-two"
}
| extend Actor = case(${join("", [for k, v in var.developer_aliases : "Actor == \"${k}\", \"${v}\", "])}Actor)
The canonical value is the GitHub login, because that is the identifier that is unique and stable. The map is applied before anything groups by actor, so every panel and every count sees one person once.
Two more notes on this. Assignees never need the alias map, because those always come from a GitHub account and are always a login. And the real fix is upstream: adding the missing email to the GitHub account stops new split rows appearing. The alias map cleans up the history that already exists.
There is also a flag for the underlying condition, so the split is visible rather than silently patched:
| extend IsResolvedAccount = Actor !contains " "
A name with a space in it is a git config name rather than a login, which is a decent heuristic for “this commit’s email is not linked”.
Labels, for features and bugs
The search response carries labels, so those come along:
Labels:     ([.labels[]?.name] | join(", ")),
LabelArray: [.labels[]?.name]
Both forms, for the reason from the GraphQL article: the string reads well in a table, the array makes membership exact.
| extend IsFeature = LabelArray has "feature"
| extend IsBug     = LabelArray has "bug"
has against the array rather than contains against the string, because bug is a substring of debug and of bugfix.
I nearly took a shortcut here and joined closed issues back to the board table to get their labels, since the board already has them. That would have been wrong: a closed issue is not necessarily a project item, and the join would have silently dropped the ones that are not.
The honest caveat, which belongs on the panel and not just in my head: only about forty-five issues in a thirty-five day window carry either label. The chart is a floor, not the whole story, and I would rather say so than let somebody read it as complete.
Commits are not a comparable unit
One more thing that belongs in the design rather than in a footnote.
Commit counts are not comparable between people. A developer who squashes before merging has one commit where somebody who merges a branch has fourteen, for identical work. Our data had one person with two orders of magnitude more commits than another over the same ten days, and the second of them had merged far more pull requests than the first.
So the dashboard shows commits, because the heat map of daily activity is genuinely useful for seeing rhythm and gaps, and it leads with merged pull requests and closed issues for anything comparative. The weekly throughput chart plots merges and closures only. The panel descriptions say why.
That is a presentation decision rather than a collection one, but it is worth making at collection time, because it tells you that you need the merge and closure data at all rather than just the commits.
Conclusion
The mechanics of this collector are the easiest of the three. It is one more table on an existing job, one more stream on an existing rule, and a jq expression per source.
Everything difficult about it is that the subject is people. Bots inflate the numbers, split identities halve them, and commit counts are not comparable between individuals in the first place. None of those produce an error, and all of them produce a chart that looks fine and ranks people wrongly.
The specific habit I would recommend is to run a summarize by Actor over the raw data and read the whole list before you build a single panel. It took thirty seconds and it surfaced four identities belonging to two people, two coding agents masquerading as prolific contributors, and the commit-count disparity that changed which metric the dashboard leads with. The next four articles are the dashboards, starting with the one that answers what is about to go to production.