Two Jobs, Not One Faster Job
The roadmap collector runs once a day and snapshots the project board. That is the right cadence for a burn-up chart and completely wrong for a pull request that was opened twelve minutes ago.
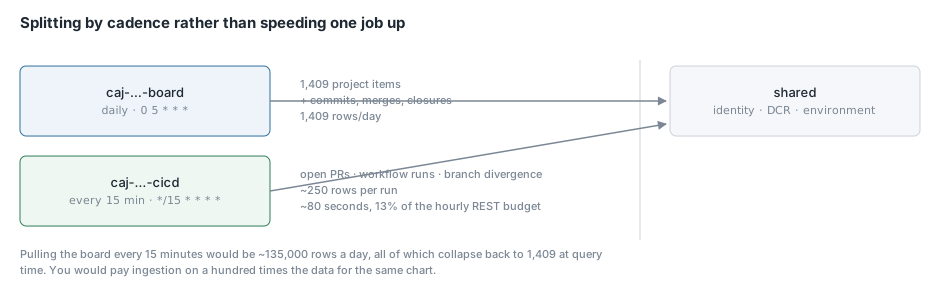
This article is the second collector in the same Terraform layer: a job that runs every fifteen minutes and gathers open pull requests, recent workflow runs, and how far each service’s develop branch has drifted from main. It shares the layer, the identity and the data collection rule with the daily job. Only the schedule and the script differ.
Why the split
The obvious move when somebody says “we need this fresher” is to change the cron expression. That would have been wrong here, and the arithmetic is worth writing down because the same shape comes up whenever one dataset in a layer is much larger than another.
The board is about 1,400 items. At ninety-six runs a day that is about 135,000 rows daily, all of which collapse back to ~1,400 at query time because the dedup key is (SnapshotDate, ItemId). You would pay ingestion on a hundred times the data for an identical chart.
The fast-moving data is much smaller. Twenty-odd open pull requests, a couple of hundred workflow runs in a rolling window, twenty-six branch comparisons. Roughly two hundred and fifty rows a run, which is nothing.
So: two jobs, one layer.
resource "azurerm_container_app_job" "delivery" {
  name                         = "caj-<project>-devops-cicd-<region>"
  container_app_environment_id = azurerm_container_app_environment.roadmap.id

  replica_timeout_in_seconds = 300
  replica_retry_limit        = 1

  schedule_trigger_config {
    cron_expression          = "*/15 * * * *"
    parallelism              = 1
    replica_completion_count = 1
  }

  identity {
    type         = "UserAssigned"
    identity_ids = [azurerm_user_assigned_identity.job.id]
  }
  ...
}
The timeout is five minutes rather than the hour the daily job gets. A collection that has not finished in five minutes has hit something pathological, and the next run is fifteen minutes away. Failing fast keeps a wedged replica from overlapping its successor, which matters much more on a fifteen minute cadence than on a daily one.
Retry limit is one rather than two, for the same reason.
Discover the repositories rather than listing them
The collector walks every repository in the organisation, and the list comes from the API rather than from a variable:
PAGE=1
: > "${WORK}/repos.ndjson"
while :; do
  code=$(gh_get "${GH}/orgs/${GITHUB_ORG}/repos?per_page=100&type=all&page=${PAGE}" "${WORK}/page.json")
  n=$(jq 'length' "${WORK}/page.json")
  jq -c '.[] | select(.archived == false) | {name, default_branch}' "${WORK}/page.json" \
    >> "${WORK}/repos.ndjson"
  [[ "$n" -lt 100 ]] && break
  PAGE=$((PAGE + 1))
done
There are fifty-six active repositories and that number changes faster than anybody will remember to update a tfvars file. A repository created on Monday should appear on the board on Monday.
Archived repositories are dropped. A frozen repository has no CI health worth alerting on, and leaving them in means a permanently empty row on every chart.
Per repo, not per search
For pull requests there are two options and I want to explain why I picked the more expensive one.
GitHub’s search API can return every open PR in the organisation in a single call:
GET /search/issues?q=org:ORG+is:pr+is:open
One request instead of fifty-six. It is obviously better, and I did not use it, because search is an index and it lags. By an amount nobody controls or publishes. A board that refreshes every fifteen minutes and misses a pull request opened twenty minutes ago is worse than not having the board, because it teaches people the board is behind and then they stop trusting the parts that are current.
The loop is already visiting every repository for workflow runs, so the authoritative endpoint is nearly free:
code=$(gh_get "${GH}/repos/${GITHUB_ORG}/${REPO}/pulls?state=open&per_page=100" "${WORK}/pulls.json")
Search is the right tool where the lag does not matter. Two articles from now, the developer activity collector uses it for merged pull requests and closed issues, because that runs daily and six calls instead of fifty-six is a real saving on a job that also walks every repo for commits.
The rule I would give: use search for historical rollups, use the authoritative endpoint for anything a person will look at and expect to be current.
Three shapes in one job
Pull requests are state. Every open PR, every run, tagged with a snapshot time. Note that this is a full timestamp rather than a date, because the whole point of the fast job is that two snapshots in one day differ.
{
  TimeGenerated: $now,
  SnapshotTime:  $now,
  Repository:    $repo,
  Number:        .number,
  Title:         (.title // "(untitled)"),
  Author:        (.user.login // ""),
  IsDraft:       (.draft // false),
  BaseBranch:    (.base.ref // ""),
  HeadBranch:    (.head.ref // ""),
  CreatedAt:     .created_at,
  UpdatedAt:     .updated_at,
  Url:           (.html_url // ""),
  Labels:        ([.labels[]?.name] | join(", ")),
  ReviewerCount: ([.requested_reviewers[]?] | length)
}
ReviewerCount earns its place. Zero requested reviewers on a review-ready PR is its own failure: nobody was ever asked, so nobody is late. That is a different problem from a slow reviewer and it wants a different conversation. When I first ran this, every review-ready PR had zero requested reviewers.
Workflow runs are events that mutate before they settle. A run goes queued, then in progress, then completed. The collection is windowed by creation date so a busy repository does not drag its whole history back every run:
code=$(gh_get "${GH}/repos/${GITHUB_ORG}/${REPO}/actions/runs?per_page=${RUNS_PER_REPO}&created=%3E%3D${SINCE}" ...)
A run still in flight when we read it is read again on the next pass and written again with its newer status. The saved function keeps the latest by run id:
GitHubWorkflowRun_CL
| summarize arg_max(TimeGenerated, *) by RunId
conclusion is null while a run is in flight, and I store an empty string instead:
Conclusion: (.conclusion // ""),
Keeping the column a string rather than a nullable one means a panel can group on it without special-casing the in-flight case.
Duration is derived at query time rather than stored, so a re-read of an in-flight run corrects it instead of freezing whatever it was mid-flight:
| extend DurationSeconds = iff(IsComplete, datetime_diff('second', UpdatedAt, StartedAt), int(null))
| extend WaitingMinutes  = iff(IsInFlight, datetime_diff('minute', now(), CreatedAt), int(null))
WaitingMinutes is the one that finds a specific failure. A run stuck at “queued” for an hour is usually a runner that never picked it up, and on a board it looks nothing like a red test. Without the minutes it just shows as in-flight forever.
Branch divergence is state, one row per repository per run:
code=$(gh_get "${GH}/repos/${GITHUB_ORG}/${REPO}/compare/${BASE}...${HEAD}" "${WORK}/cmp.json")
{
  Status:         (.status // "unknown"),
  AheadBy:        (.ahead_by // 0),
  BehindBy:       (.behind_by // 0),
  TotalCommits:   (.total_commits // 0),
  FilesChanged:   ((.files // []) | length),
  LastCommitDate: ((.commits // []) | last | .commit.committer.date // null)
}
AheadBy is the size of the next push from dev to production. BehindBy means the opposite thing and is tracked separately: commits on main that develop does not have, which means a hotfix went straight to production and was never merged back down. That is a correctness risk rather than a release-size one, and folding them into one number would hide it.
LastCommitDate is what makes “this has been sitting unreleased for three weeks” answerable, rather than only “this is twenty-five commits ahead”.
Skip, do not zero
The branch comparison returns 404 for a repository that has no develop branch, or no main. That is the normal case for about half of them: framework libraries, governance repositories, documentation. Of fifty-six repositories, twenty-six are on the release train.
The helper returns the HTTP status so callers can tell a real failure from an expected 404:
gh_get() {
  curl -s -o "$2" -w '%{http_code}' -H "$AUTH" -H "$API" "$1"
}
and a 404 skips the repository quietly rather than failing the run for the other fifty-five, or worse, emitting a zero.
That last part matters. A zero on the release pressure chart reads as “nothing to release”, and the truth is “not applicable”. Those look identical on a bar chart and mean completely different things. The repositories with no develop are absent from the panel rather than sitting at the bottom with a zero.
Rate limits
Three calls per repository, fifty-six repositories, four runs an hour is about 672 requests an hour against a 5,000 limit. Thirteen percent, with room to go faster if fifteen minutes ever proves too slow.
A full run takes about eighty seconds.
Worth noting that the search API has a separate and much tighter limit, thirty requests per minute rather than five thousand per hour. That is another argument for the per-repo endpoints on a job that runs this often.
Conclusion
The decision I would carry into any similar system is the one in the title. When somebody asks for fresher data, check whether the whole dataset needs to be fresher or only part of it. Splitting into two jobs on the same layer cost one extra Terraform resource and a second script, and it avoided a hundredfold increase in ingestion for no gain.
The second thing is the search-versus-authoritative call, which I think is more subtle than it looks. Search was the obviously efficient choice and it was wrong for this job and right for the next one, and the deciding factor was not cost or convenience but whether a human would be looking at the result and expecting it to be current. The next article is the third collector, where search is the right answer.