Turning Log Analytics Into a Business Intelligence Warehouse
We have been running Grafana over Azure Monitor for a while now to answer operational questions. Is the platform up, are the pods running, how bad is the p95 latency on one of our services this afternoon. That part is well-trodden. Azure Monitor collects the telemetry whether you ask it to or not, Azure Managed Grafana can point at the workspace, and you write some KQL.
Then the questions started drifting away from operations. How much are we spending, and on what. How much sales activity did the team log last week. How close are we to being done with the MVP. Which pull requests have been sitting open for two months. These are business intelligence questions, and the instinct when somebody asks a business intelligence question is to go and get a business intelligence tool.
I did not want to do that, and this series is about what we built instead. This first article lays out the architecture, because all three of the collectors I am going to describe follow the same shape, and I would rather explain it once properly than badly three times. Everything after this one refers back to it.
Before I get into it, a bit of history, because this is the third time I have built some version of this and the first two are why the third one went as well as it did.
The first was at Microsoft, where I spent a good while building synthetic health signals for Azure. The problem there was that a service being technically up tells you very little about whether it is working, so we built probes that exercised real paths and reported on what they found. That work is where I learned most of what I know about designing a health signal rather than just a metric: what a signal should do when it has nothing to say, how you tell “no data” apart from “no problem”, and why a dashboard that omits the broken thing is worse than no dashboard at all. If that sounds like it is going to come up again in this series, it is, in about three articles.
Along the way I discovered the Grafana Terraform provider, which I had assumed would be a thin wrapper over a couple of endpoints and turned out to be enormous. I enjoyed it enough to pitch a talk about it, was surprised to be selected, and then flew thirty hours to Sydney to give a thirty-minute talk on Terraforming Grafana at HashiDays. I wrote that up at the time as a four-part series covering the Managed Grafana instance, the provider’s authentication, dashboards as code, and the pipeline to deploy them. If you want the mechanics of the Grafana provider itself, start there. This series assumes it and moves on.
What is different this time is who the dashboards are for. At Microsoft it was all telemetry for engineers. Now I am doing it at a startup, where the interesting questions are as often commercial as technical, and where the same person frequently needs both answers in the same five minutes. How much are we spending, how much did the sales team do this week, how close is the MVP, is anything on fire. Getting the business side and the technology side onto one platform, with one query language and one set of access controls, has turned out to matter more than any individual chart on it.
Why not just use a BI tool
The honest reason is that a second stack is a second stack. Whatever we picked would need its own storage, its own identity model, its own network path into Azure, its own cost line, and its own place for somebody to log in. We would then have operational dashboards in one product and business dashboards in another, and the day somebody wants to put spend next to pod health on the same screen, we would be stuck.
The other reason is that we were already paying for a perfectly good time series warehouse and using it for nothing but logs. A Log Analytics workspace will hold whatever you put in it. It is columnar, it is indexed by time, it has a retention policy, it has RBAC, and it has a query language that is genuinely pleasant once you stop trying to write SQL in it. Grafana already had a data source pointed at it, authenticating with a managed identity that already worked.
So the question I actually needed to answer was not “which BI tool” but “how do I get non-telemetry data into the workspace”. Everything below is the answer, in the order you would build it.
The shape of the thing
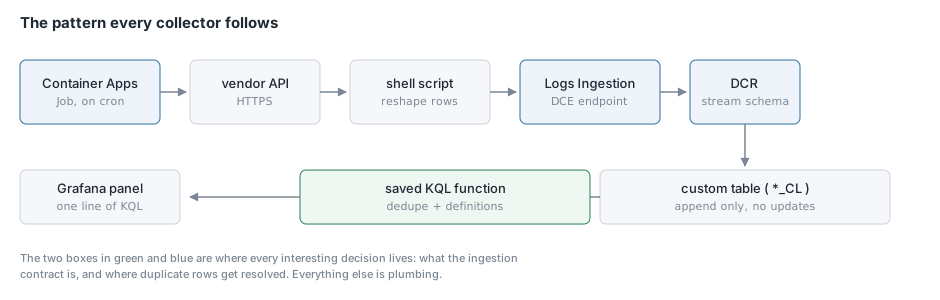
Every collector we built ends up looking like this:
scheduled job  ->  vendor API  ->  reshape to a stream schema
               ->  Logs Ingestion API  ->  DCE  ->  DCR
               ->  custom _CL table  ->  saved KQL function  ->  Grafana panel
There are six steps in there worth talking about, and the last three are where all the interesting decisions live.
Step 1: Run the collector as a Container Apps Job
The first collector I wrote pulls Azure spend once a day. My first instinct was a Container App, and that was wrong. A Container App is a long running service. It would sit there idling twenty-three hours and fifty-nine minutes a day waiting to do one thing, and it would need its own scheduler inside it to know when that thing should happen.
A Container Apps Job takes a cron expression, spins a replica when the cron fires, runs to completion, and scales back to zero. You are billed for the seconds it runs. Our daily collectors run for a couple of minutes, which rounds to nothing.
resource "azurerm_container_app_job" "cost" {
  name                         = "caj-<project>-finops-cost-<region>"
  container_app_environment_id = azurerm_container_app_environment.finops.id

  replica_timeout_in_seconds = 1800
  replica_retry_limit        = 2

  schedule_trigger_config {
    cron_expression          = "0 6 * * *"
    parallelism              = 1
    replica_completion_count = 1
  }
  ...
}
One thing that is easy to miss and cost me an afternoon. Setting log_analytics_workspace_id on the Container Apps Environment is not sufficient to get your job’s console output anywhere. You also need this:
logs_destination = "log-analytics"
Without it the job runs, reports success, writes nothing, and gives you no logs to explain why. My first cost collection run said “Succeeded” having ingested zero rows, and I had nothing at all to look at.
While I am on the subject of things that bite you at deploy time rather than plan time, a Container Apps Job name is capped at thirty-two characters, and the provider only enforces it during apply. I had two jobs named caj-<project>-devops-roadmap-<region> and caj-<project>-devops-delivery-<region>, at thirty-three and thirty-four characters. The plan printed a clean summary and said nothing. The apply failed on both.
Step 2: Run a stock image with your script as an argument
I did not build a container image for any of these. The job runs mcr.microsoft.com/azure-cli:latest and the collector script is passed in as an argument:
command = ["/bin/bash", "-c"]
args    = [file("${path.module}/scripts/collect-cost.sh")]
That image already has az, curl, jq and bash, which is the entire dependency list. More importantly there is no build pipeline standing between changing a line of the collector and deploying it. The script is still version controlled, it is still reviewed, and it still ships through Terraform. It is only the thing executing it that is off the shelf.
If the logic ever outgrows a shell script I will build an image, and the change will be one variable. Until then I would rather not maintain a Dockerfile and a registry push for two hundred lines of jq.
There is one trap in this approach that took me three failed job runs to find, and it does not reproduce on a Mac. Linux caps a single argv entry at 128 KB. When you build a JSON payload in a shell variable and hand it to curl as --data-binary "$CHUNK", you are putting the whole payload on the argv, and once a chunk of wide rows crosses that limit the job dies with “Argument list too long”. It looks like a jq problem. It is not. Write the chunk to a file and pass @file instead:
printf '%s' "$CHUNK" > "${WORK}/chunk.json"
curl -s -X POST "${DCE_ENDPOINT}/dataCollectionRules/${DCR_ID}/streams/${STREAM}?api-version=2023-01-01" \
  -H "Authorization: Bearer ${INGEST_TOKEN}" \
  -H "Content-Type: application/json" \
  --data-binary "@${WORK}/chunk.json"
The same limit applies to jq --argjson, which is how I hit it the first time, accumulating paginated API results into a growing variable and feeding it back in on each page.
Step 3: Create the custom table, the endpoint and the rule
This is the part that is genuinely unfamiliar if you have only ever read from Log Analytics. To write custom data in, you need three things.
First, a custom table, whose name must end in _CL. There is no azurerm resource for creating one. The azurerm_log_analytics_workspace_table resource only adjusts retention and plan on tables that already exist, so you have to go at the Tables ARM API directly with azapi:
resource "azapi_resource" "cost_table" {
  type      = "Microsoft.OperationalInsights/workspaces/tables@2022-10-01"
  name      = "AzureCost_CL"
  parent_id = data.azurerm_log_analytics_workspace.shared.id

  body = {
    properties = {
      retentionInDays      = -1
      totalRetentionInDays = -1
      schema = {
        name    = "AzureCost_CL"
        columns = local.cost_columns
      }
    }
  }
}
Second, a Data Collection Endpoint, which is the URL you actually POST to. We already had one in the shared observability workspace, so all three collectors share it.
Third, a Data Collection Rule, which declares a stream with a schema and a data flow saying where rows on that stream should land. The stream schema and the table schema have to agree exactly, which is precisely the sort of thing that goes wrong when somebody adds a column in one place and not the other. Declare the column list once as a local and use it in both:
locals {
  cost_columns = [
    { name = "TimeGenerated", type = "datetime" },
    { name = "CostDate",      type = "datetime" },
    { name = "ServiceName",   type = "string" },
    { name = "Cost",          type = "real" },
    ...
  ]
}
The identity story here is small and worth getting right. The job authenticates with a user-assigned managed identity, and the only Azure permission that identity needs in order to write is Monitoring Metrics Publisher, scoped to the one DCR. The role mentions metrics but it is what the Logs Ingestion API checks. That identity cannot read the workspace back and cannot see anything else in the subscription.
I use user-assigned rather than system-assigned deliberately. A system-assigned identity is created and destroyed with its parent resource, so the first time you replace the job you silently orphan every role assignment that identity held. With a user-assigned identity the grants outlive the job.
One last thing about this step, and it is the one that wasted the most of my time across the whole project. Changes to a DCR take several minutes to reach the ingestion endpoint. If you apply a schema change and immediately trigger the job, you get two completely different failure modes from one cause. A brand new stream is rejected outright with a clear 400 telling you the stream is not configured. New columns added to an existing stream are silently dropped, so the job reports success, writes the rows, and leaves your new columns null. I chased that second one for a while before I realised the first one was telling me what was going on. Wait five or ten minutes after a schema change before you judge the results.
Step 4: Decide whether your data is state or events
This is the constraint that shapes everything downstream, and it took me a little while to stop fighting it.
You cannot update a row in Log Analytics. There is no primary key and there is no upsert. If a fact changes, all you can do is write it again and deal with the duplication at read time.
That turns out to be fine, but only if you decide up front which of two shapes you are dealing with.
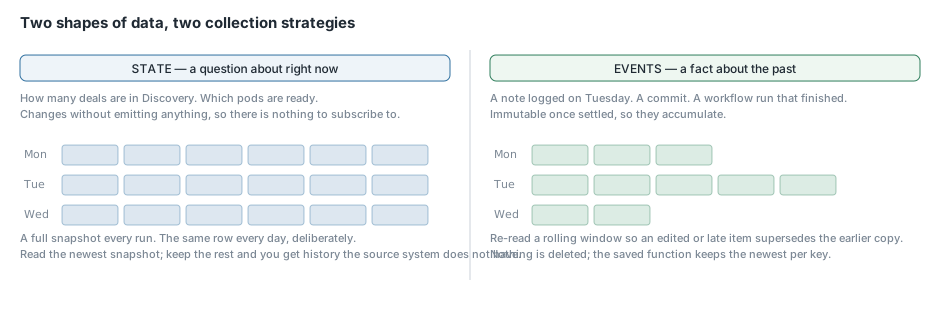
State is a question about right now. How many deals are in each pipeline stage. Which pods are running. How far ahead of main each service is. The answer changes without anything emitting an event, so there is nothing to subscribe to. The only honest way to record it is to write a full snapshot on every run, tagged with the snapshot time, and have the dashboard read the newest one.
The nice side effect is that you get history the source system does not keep. GitHub does not store what your project board looked like a month ago. After a month of snapshots, you do, and a burn-up chart becomes possible that the source system cannot draw.
Events are facts about the past that do not change once they settle. A note logged on Tuesday, a commit, a workflow run that finished. Those accumulate, and you window the collection so each run re-reads a rolling period rather than the entire history. Something that was still in flight when you read it gets read again on the next pass and superseded by its finished state.
Getting this wrong in the direction of treating state as events means your dashboard cannot answer “what does it look like now” without a lot of work. Getting it wrong in the other direction means you write enormous volumes of duplicate rows. Our GitHub project board is about 1,400 items. Snapshotting it daily is ~1,400 rows a day, which is nothing. Snapshotting it every fifteen minutes, which I briefly considered so that the work-in-progress numbers would be fresher, would be about 135,000 rows a day to say the same thing.
Step 5: Put the semantics in a saved function
Because everything is append only, every correct query has to deduplicate, and every incorrect one silently multiplies your numbers instead of failing. That is a bad property for a wall display. Nobody notices a chart that is wrong by a factor of three if the shape looks plausible.
So I do not let panels talk to the raw tables. Each table gets a saved search registered as a function, and the function does the dedupe:
AzureCost_CL
| summarize arg_max(TimeGenerated, *) by CostDate, SubscriptionId, ResourceGroup, ServiceName
| project CostDate, SubscriptionName, ResourceGroup, ServiceName, Cost, Currency
A panel calls AzureCostLatest() and physically cannot get it wrong. During one of the GitHub collections a job failed partway through and retried twice, so a table ended up holding four copies of every row. The function returned the correct count. That is the entire point of it.
The functions do more than dedupe, though, and this is the part I would encourage you to steal. Any definition that more than one panel depends on belongs in the function rather than in the panels. What counts as a stale deal. What counts as work in progress. Whether an account nobody has ever touched is a follow-up failure or just an import nobody has started on. If three panels each decide for themselves what “stuck” means, you have three different answers to one question and no way to tell which one is on the screen.
There is a sharp edge here that cost me a deploy. A saved search used as a function has to be a single tabular expression. If the body opens with a let statement, Terraform saves it perfectly happily and then every panel that calls it fails at query time with a parse error. I had written three functions that way. The apply was green, the dashboards were broken, and the error points at the function body rather than at the panel, so it takes a minute to work out what you are looking at. Where I needed a scalar I inlined it:
GitHubWorkItem_CL
| where SnapshotDate == toscalar(GitHubWorkItem_CL | summarize max(SnapshotDate))
Related, and in the same spirit of things that are only wrong at runtime: # starts a comment in HCL everywhere except inside a heredoc, where it is just text. I wrote several # comments inside the KQL of a saved search body, which went into the query verbatim and broke it. KQL comments start with //.
Step 6: Manage the Grafana content as code
The dashboards themselves are Terraform. There is a directory of JSON templates, one file per dashboard, foldered by directory, and a fileset() walk turns each one into a grafana_dashboard resource:
locals {
  dashboard_files = fileset("${path.module}/dashboards", "**/*.json.tftpl")
}

resource "grafana_dashboard" "this" {
  for_each    = local.dashboards
  folder      = grafana_folder.this[each.value.folder].uid
  config_json = each.value.config
  overwrite   = true
}
Adding a dashboard is dropping in a file. The workflow we actually use is to author in the Grafana UI, export the JSON, and commit it, which means this layer is not the editor, it is the thing that makes the result reproducible. templatefile() injects the data source UID and workspace resource ID so that no panel carries an environment-specific identifier and the same JSON can be pointed at another instance later.
Two things about this step bit me and both are worth knowing before you start.
The first is that overwrite = true combined with a fileset() walk means the apply is a mirror of your working directory. That is exactly what you want when you are on the right branch. It is emphatically not what you want when you run an apply from a branch that does not have your new dashboards on it yet, because Terraform compares the dashboards in state against the files on disk and cheerfully deletes the difference. I did this to myself twice in one afternoon. The plan output reads 0 to add, 0 to change, 7 to destroy, and the only word in that line that matters is the last one.
The second is that Grafana and Terraform both use ${...} for interpolation. A data link that references ${__data.fields.Url} has to be escaped as $${__data.fields.Url} or templatefile() will try to resolve it as a variable and fail the plan.
What this costs
The three collectors together amount to a resource group with a Container Apps Environment, a handful of jobs, a user-assigned identity per layer, a data collection rule per layer, and some custom tables. The jobs run for a couple of minutes a day, apart from one that runs every fifteen minutes and takes about eighty seconds. The custom tables inherit the workspace retention rather than pinning their own.
I am not going to pretend I have a precise figure, because it is buried inside a workspace bill we were already paying, which is sort of the point. The marginal cost of adding a few thousand rows a day to a Log Analytics workspace that is already ingesting container logs is not the line item anybody is going to ask about.
What is coming next
The rest of this series works through each data source end to end, in increasing order of how much fighting was involved.
I will start with our Platform Operations dashboard, which is the odd one out because it has no collector at all. Azure Monitor already populates everything it reads, and it is a good demonstration that the right answer is sometimes to write no pipeline whatsoever.
Then Azure cost, which is the simplest real collector and the one where the restatement problem forces you to confront append-only storage immediately.
Then our CRM data out of HubSpot, which has more objects and more association plumbing than you would expect, and where getting the week boundaries wrong quietly produces numbers that look right.
Then GitHub, which needed two collectors on different schedules, produced five dashboards, and is where I made most of my mistakes.
For each one I will go through the collector code, the Terraform, the scopes the integration actually needs as opposed to the ones the documentation implies, and then every panel on every dashboard with the query that produces it.
Conclusion
The pattern in this article is not clever, and that is deliberate. A cron job, a shell script, an HTTP POST, a table, a function, a dashboard. Every piece of it is something you already know how to operate, and none of it introduced a new product into our stack or a new bill onto our invoice. What made it work was picking the right two decisions early: treating the Log Analytics workspace we were already paying for as a warehouse rather than a log bucket, and accepting that append-only storage means the deduplication has to live somewhere deliberate rather than being sprinkled through the panels. Everything else in this series is that same shape applied to a different API, and most of what I got wrong was a detail of one of those APIs rather than anything architectural. If you take one thing from this article, take the saved function boundary. It is the piece that keeps a dashboard honest as it grows.